Interest Rate adjusted Data
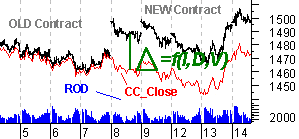
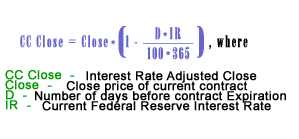
To trade futures on a long-term basis anybody needs a long track of correct data. But the most active lifetime of well known futures contracts are about 1-3 months from "Roll-Over-Day" to "Roll-Over-Day" (ROD to ROD). Putting those together in one database to satisfy your analytical and charting needs, you are getting a terrible "noise" - the gaps in prices between two (old and new) contracts.


Look at the CC Data file layout (Tab.1) for detail.
| Field name | Field type | Field Description |
|---|---|---|
| Ticker | Character (2) | Contract symbol ( ES, NQ ... ) |
| Intra day mark("I" symbol); | Character (1) | "I" symbol |
| Date | YYMMDD | The calendar date of trade |
| Time | HH:MM | The time from the beginning of minute interval (Hours, Minutes), CST Chicago time |
| Open | Number (6,2) | The price of the first trade in interval |
| High | Number (6,2) | The highest price in interval |
| Low | Number (6,2) | The lowest price in interval |
| Close | Number (6,2) | The price of the last trade in interval |
| Volume | Integer | The number of contracts of trades in interval |
| CC Close | Number (6,2) | The adjusted price of the last trade in interval |
Up/Down Tick Data History
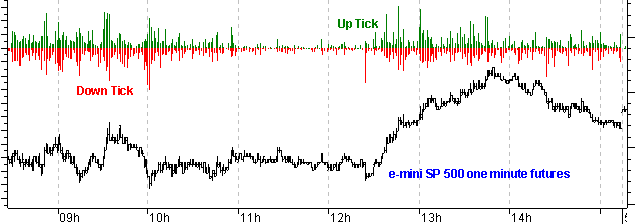
An up tick is a tick that is higher than the previous tick (or the same as the previous tick). Up Tick returns the number of up ticks on a bar whose value is higher than the tick immediately preceding it or the same as the previous tick. A down tick is a tick that is lower than the previous tick (or the same as the previous tick). Down Tick returns the number of down ticks on a bar whose value is lower than the tick immediately preceding it or the same as the previous tick. Up Volume is a volume of Up Tick's on a bar. Down Volume is a volume of Down Tick's on a bar.
Up/Down Tick Chart helps to answer the quesions: Are traders strong involved in the market? Where traders placed stop orders? When traders prefer buy or sell?

ANFutures provides Up/Down Tick Data history in CSV (text) format with a 01 minute time interval. We offer Up/Down Tick Data of Globex Time Hours . Every history tick data file includes data for 3 months contract's period from roll-over day to roll-over day. It fits exactly to our CC Data history. Tick data files are ZIP compressed for faster download.
Look at the Up/Down Tick Data file layout (Tab.2) for detail.
| Field name | Field type | Field Description |
|---|---|---|
| Ticker | Character (2) | Contract symbol ( ES, NQ ... ) |
| Time frame; | Character (2) | "01" symbols |
| Date | YYMMDD | The calendar date of trade |
| Time | HH:MM | The time from the beginning of minute interval (Hours, Minutes), CST Chicago time |
| UpTicks | Integer | The number of up ticks in interval |
| DnTicks | Integer | The number of down ticks in interval |
| UpVolume | Integer | The volume of UpTick's in interval |
| DownVolume | Integer | The volume of DownTick's in interval |
There is an additional option for CC Data. It includes up/down tick and up/down volume only. To get price data with Up/Down Ticks you must have our CC Data and Tick Data files and use Data Converter to compose price data with up/down ticks. Look at the tick data file layout below for detail. You can download the Sample Up/Down Tick Data file to learn more, it is absolutely free. To combine CC Data and Up/Down Tick Data to get new one with different format (3,5,10,15,20,30 and 60 min) use our Data Converter 2.1 for free.
Data makes a difference
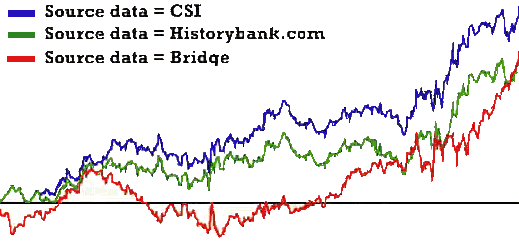
Why it is important to use most accurate data in system developing? All data providers have data that may differ from data CME has itself. With the sample below the cumulative effect of the 5*0.25 on a seven bars was reflected in a triggered Buy signal on a CME data one bar earlier than on a eSignal data. Signal generation one bar earlier/later may bring additional win/loss on a short time period. With a long time trading win/loss as a result of difference in data will offset each other. But if you use data from different data vendors you might get strange result in track during system testing

"...Even if all vendors reported prices the same way, differences in their data still would exist. Data are processed and reformatted several times between the pit and trader's computer, and errors can occur along way. The exchange computer passes information with bids, offers and trades to real-time data vendors who reformat it and send it on to users of tick-by-tick data. Most end-of-day vendors get their raw prices from this real-time vendors, not directly from the exchange computer. ...What really matters is whether or not the data differences affect system test result. To find out, we tested a simple S&P 500 trading system using Omega Research's TradeStation200i on continuous contracts from three different vendors. The system itself is a simple version of the popular volatility-adjusted breakout strategy. It is always in the market, either long or short. This equity curves highlight the variability in the system test result based on the data differences. The test period was 2 years long (from Jan. 97 to Dec. 98.) The results varied greatly, with net profit ranging from $95,275 with Historybank.com data to $127,500 for CSI, and drawdowns of $25,375 for CSI to $45,475 for Bridge. When trading a system in real time, you must trigger your trades with the same kind of prices used for testing or the results will not match the test..." From the article: Sheldon Knight. "How clean is your end-of-day data?" Futures Magazine, Volume 28, Number 9
© 2000-2023 ANFutures.com